Why your Squads are probably not Estimating in an Agile way
If you want to start seeing a happier Squad and robust delivery forecast, now is the time to embed relative sizing into their approach.
Most projects will miss their original deadlines. Often this is associated with one particularly complex type of project. The type where one cannot see what is just around the corner.
It is a familiar, sticky conversation.
An Executive asks a Development Team whether their project can be delivered by the end of the quarter and within budget. The Development Team are unable or unwilling to reply based on a concern their reply could be interpreted as a firm commitment, despite the many unknown factors. The project manager may attempt to appease both sides whilst struggling to assemble the plan.
The Executive presses: “OK. What do you need to do to confirm?” The Lead Developer replies, “Joanne keeps requesting additional Features. We uncover new Technology issues as we code. We keep finding more bugs than we can fix!”
So, how can we solve this?
What is ‘best practice’ and why?
The sizing of software development work revolves around story points. This is the industry standard item used to represent the size, complexity and effort required to complete a work item. Assigning story points to working days or with linear numbers is one simple, frequently utilised method. A story point assigned to the number two is twice as complex as a story point assigned the number one. However, when attempting to qualify how much more complex is a number 9 compared to a number 8 this approach falls down. How, then, can we determine how much weight each story point should carry?
The Fibonacci scale provides a Squad with a far more accurate framework for estimating story points based on relative sizing. Each story point can be assigned a number from the scale; the higher the number, the more complex the story point and effort required to complete. This prevents estimates from being too close to one another. The exponential nature of the scale provides a method for understanding what the numbers assigned mean in terms of complexity [1]. For example, a 1 could mean a straightforward story point to be completed within an hour. Several of these tasks could be completed within a day. A 13 could mean the story point is very complex and could take weeks to complete. This process of assigning story points to higher numbers encourages a squad to account for the complexity and effort required to complete the task, thus forming a more reliable estimation.
What else to account for and how?
The effort for other factors likely of affect development time can also be incorporated into the sizing via this approach. This includes the time a Squad spends fixing bugs, unblocking systems, and dealing with spikes may be unknown, relative sizing helps a Squad to account for this as these items can be accounted for via an estimation. This is particularly important as humans tend to be very inaccurate when estimating unknown factors. Bugs related to a User Story already marked as complete can be raised via a ticket in the Agile Management Tool, and thus included with estimations. Bugs identified during testing before a ‘User Story’ completion does not require estimation as they can be factored into the original estimation. Measuring effort for unblocking systems and spikes can be approached in a similar manner.
The process of estimating each of these components and iterating throughout an Epics life requires a portion of the team’s time. However, the better the quality and completeness of the information used for estimations, the more accurate the estimation becomes. A squad could use the Planning Poker Technique [2], using cards, a Fibonacci scale, and agreement from team members regarding what the ratios mean. This can be easily implemented face to face or remotely. In practice, once the first story point has been completed, the team can size the remaining items according to their estimated size and complexity (smaller, larger, and by what ratio, per the Fibonacci scale).
What are the benefits?
Firstly, completing effort sizing as outlined can be massively beneficial to a squad. With story points estimated based on the relative sizing to define what can be assigned to each sprint. Placing oneself in the shoes of the delivery team, would you rather be accountable for an appropriately sized tranche of work with effort for bugs, unblocking systems and spikes factored into estimations, or one where effort is tied to working days with these items likely under-estimated [3]? The positive impacts of estimating effort via this approach are bolstered by the data. Based on our current work at a customer’s £40m + program, our monthly squad health surveys identified up to a 15% improvement in job satisfaction over a six-month period.
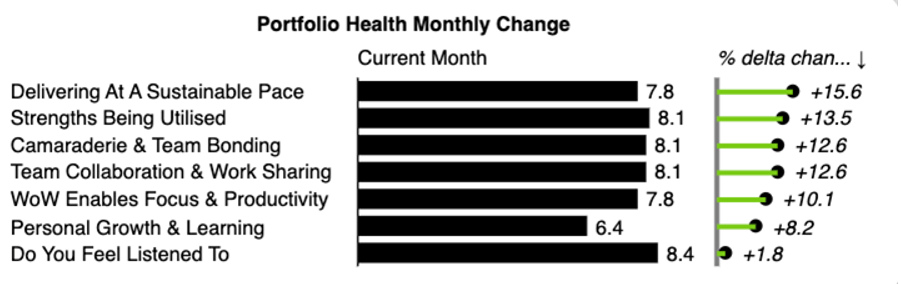 [4]
[4]
Secondly, this approach enables delivery forecasting to provide a view of an Epic or entire project’s target completion date range via predictive analytics. During the initial third or half of an Epic’s implementation, the User Stories for the whole Epic will not yet be known. However, an early prediction for the Epic’s completion can be made based on the relative sizing of its Features. After this period, there is sufficient data to form a far more accurate delivery date range, as both Features and User Stories are utilised. The equation is calculated using the extrapolation of the line through the burn-up graph as the maximum predicted date and the velocity of the prediction as to the minimum. Scope shifting can be accounted for in planning activities and updated requirements to maintain Agility. As new features are added and removed in line with requirements and priorities the target completion date range is updated.
The familiar adage comes to mind: “if you can measure it, you can manage it”. Concerns around scope creep, date commitments and overburdening a Squad can be reduced. All those involved can access objective, data-driven insights based on easy-to-digest graphs and other management information. Decision-makers can access information regarding software releases, crucial to planning and funding cycles.
Please get in contact with Will Giles at will.giles@kainos.com if you would like to discuss this further.
References
[1] Mountain Goat Software. Why the Fibonacci Sequence Works Well for Estimating. Mike Cohn. Sept. 2019.
[2] Atlassian. A brief overview of Planning Poker. Maggie Adams. Sept. 2021.
[3] Agile Connection. User Story Points versus Man-Hours: Estimating Effort Better. Nitish Tiwari. May 2015.
[4] Example Squad Health Survey results from a Customer’s Delivery Squad. The survey is completed once by each squad member monthly, with the trends monitored at governance forms and used to inform retrospectives.